Introduction
Chronic obstructive pulmonary disease (COPD) is defined as a common, preventable and treatable disease, that is characterised by persistent respiratory symptoms and airflow limitations that is due to airway and/or alveolar abnormalities usually caused by significant exposure to noxious particles or gases.1
The chronic airflow limitation that is characteristic of COPD is caused by a mixture of small airways disease and parenchymal destruction and these changes do not occur together, and they evolve over the course of time.
Chronic obstructive pulmonary disease (COPD) is a leading cause of morbidity and mortality across the world. 2 It is estimated that about 65 million people have moderate to severe COPD across the world, as per World Health Organisation. 3
In the year 2016, there were about 251 million COPD cases in the world and the mortality rate of COPD increased to 3.15 million deaths per year. 4 The economical burden of COPD in developed countries like US was as high as $50 billion 5 and the burden is much higher in low and middle-income countries which are due to its association with smoking and environmental pollution. 6
In India, the burden of all non-communicable diseases has increased since 1990. 7 As on 2016, COPD is the second leading cause of death in non-communicable diseases. 8 The prevalence of COPD in India ranges from 2% to 22% in males and 1.2 to 19% in females. 9
The Disability Adjusted Life Years (DALY) due to COPD in India had increased of about 36.3% from 1990 to 2016. The second leading cause of DALYs in India is COPD followed by diarrheal disease, lower respiratory tract infections, stroke and iron deficiency anemia. 8
With such economic and social burden, establishing a diagnosis of COPD requires spirometry as per Global initiative for Chronic Obstructive Lung disease (GOLD) guidelines. However, recent 2017 GOLD guidelines suggest that classifying COPD only by forced expiratory volume in 1 s (FEV1) % predicted is inadequate in reporting severity of the disease. 10 Thus, assessing a patient’s health-related quality of life (HRQoL) will help clinicians to make decision on management of individualised patient.
GOLD strategy suggest that COPD management can no longer be based only on spirometric classification, but through a multidimensional assessment of specific patient attributes. 11, 12, 13 (i.e., symptoms, risk factors and history of exacerbations in the previous year)
The accuracy in diagnosing COPD based on the patient’s symptoms and history of exacerbation and confirming the diagnosis with the spirometric forced expiratory volume in 1 second predicted % is analysed in our study.
Aim of the study
To check the applicability of 2017 GOLD guidelines in diagnosis of COPD based on Symptoms and exacerbations and to confirm by the spirometric grading to check for the accuracy in a tertiary care hospital.
Materials and Methods
Sample size calculation
Single Mean – Hypothesis testing – One population mean
Standard Deviation – 9.2, Sample Mean – 22.6
Population Mean – 2.5, Alpha Error – 5%
Power – 80%, Sided – 2
Effect Size – 0.2609, Number Needed [n] – 115
Methodology
All the patients fulfilling the inclusion criteria and coming to the Chest OPD at Saveetha Medical College and Hospital with the history and symptoms suggestive of COPD during July 2019 to May 2020 were included in the study.
The details were collected in the Performa and tabulated with Microsoft Excel and results were analysed with the help of Statistical software SPSS version 24.
Results
The data were collected and tabulated using Microsoft Excel, and the Statistics were analysed with the help of SPSS software. P value less than 0.05 is considered as statistically significant.
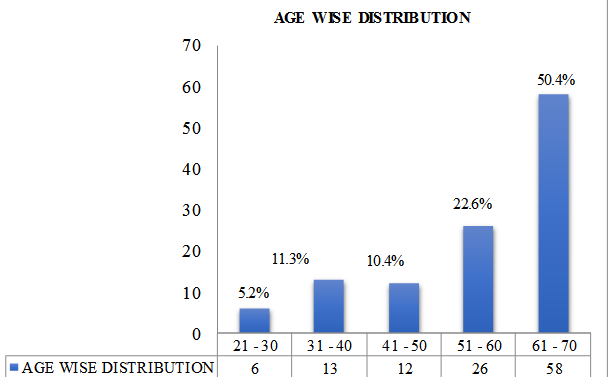
Figure 1 show the age distribution among our study population. The mean age is 56.59 years ± 12.584 in this study.
Table 1
Age wise distribution among genders
Table 2
Educational qualification
| Educational qualification | No of person | Percentage |
| Illitrate | 30 | 26.1 |
| Upto 12th | 55 | 47.8 |
| Under graduate | 29 | 25.2 |
| Post graduate | 1 | 0.9 |
| Total | 115 | 100 |
The above table shows educational qualification of our study population. Most of the study population had qualified themself up to 12th standard
Table 3
Socio economic status
| No of persons | Percentage | |
| Lower | 1 | 0.9% |
| Lower middle | 68 | 59.1% |
| Upper lower | 16 | 13.9% |
| Upper middle | 30 | 26.1% |
| Upper | 0 | 0 |
| Total | 115 | 100% |
In our study group 59% of study population belong to lower middle class followed by 26% in Upper middle which is illustrated in above table.
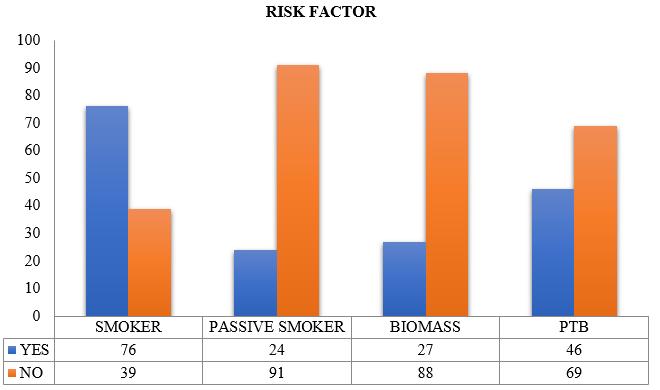
The above figure shows the risk factors associated with COPD. In our study the major risk factor was Smoking.
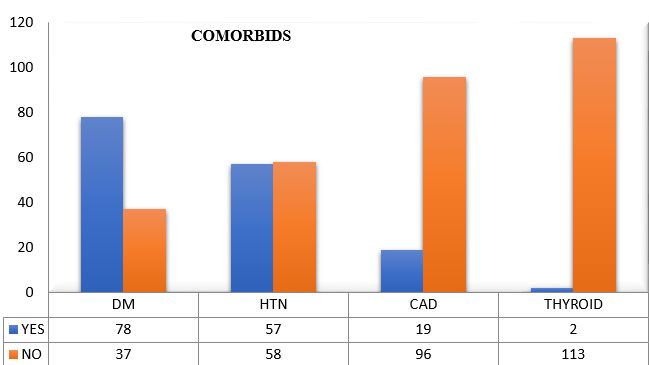
Most of the patients in our group were Diabetic (78%) followed by 57% of them were hypertensive.
Table 4
mMRCDyspnoea Grading
| No of person | Percentage | |
| ≤ 1 | 28 | 24.3 |
| ≥ 2 | 87 | 75.7 |
| Total | 115 | 100 |
| Mean ± S.D. | 1.97±0.674 | |
In our Study mMRC Dyspnoea grading score of more than 2 was found in 75.7 % of population which is represented in above table
Table 5
Cat Score
| No of person | Percentage | |
| Less than 10 | 9 | 7.8% |
| More than 10 | 106 | 92.2% |
| Total | 115 | 100% |
| Mean ± S.D. | 14.80 ± 4.117 | |
The above table shows CAT score analysis in our study group. Among the study population 106 of 115 had CAT score of more than 10.
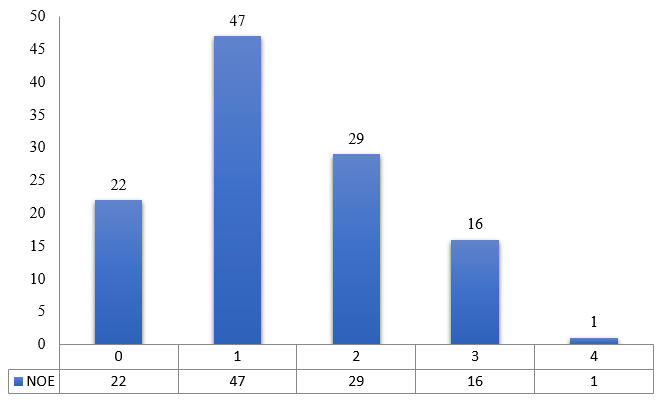
In our study group 47 people had an episode of exacerbation in the previous year.
Table 6
Number of hospital admissions
| No of HOS | No of person | Percentage |
| 0 | 58 | 50.4 |
| 1 | 41 | 35.7 |
| 2 | 15 | 13 |
| 3 | 1 | 0.9 |
| 4 | 0 | 0 |
| Total | 115 | 100 |
| Mean | 0.66 | |
| S.D. | 0.815 | |
In our study 58 people had no hospital admission in the previous year.
The above table show GOLD ABCD classification. GROUP D had more patients followed by GROUP B.
Table 8
Spirometry gold
| Gold | No of persons | Percentage |
| 1 | 0 | 0 |
| 2 | 19 | 16.5 |
| 3 | 53 | 46.1 |
| 4 | 18 | 15.7 |
| NC | 25 | 21.7 |
| Total | 115 | 100 |
The above table shows spirometric classification with maximum of 53 patients in severe group and 25 patients were not found to have COPD
Table 9
Cat score vs spirometry grade
| Spirometry gold | Cat score < 10 | Cat score ≥ 10 |
| No of person | No of person | |
| FEV1 >80 | 0 | 0 |
| FEV1 50 – 79 | 2 | 17 |
| FEV1 30 – 49 | 2 | 51 |
| FEV1 < 30 | 0 | 18 |
| NC | 5 | 20 |
| Total | 9 | 106 |
| P value | 0.045 | |
| Chi square | 8.063 | |
On comparing CAT score and Spirometric FEV1% grading maximum patients corresponds to severe airway obstruction group. The results are statistically significant with p value of 0.045.
Table 10
mMRCscore VS spirometry
| Spirometry Gold | mMRC ≤ 1 | mMRC ≥ 2 |
| No of person | No of person | |
| FEV1 >80 | 0 | 0 |
| FEV1 50 – 79 | 7 | 12 |
| FEV1 30 – 49 | 7 | 46 |
| FEV1 < 30 | 1 | 17 |
| NC | 13 | 12 |
| Total | 28 | 87 |
| P value | 0.00 | |
| Chi square | 19.010 | |
On comparing mMRC scoring and Spirometric FEV1% grading maximum patients corresponds to severe airway obstruction group. The results are statistically significant with p value of 0.00.
Table 11
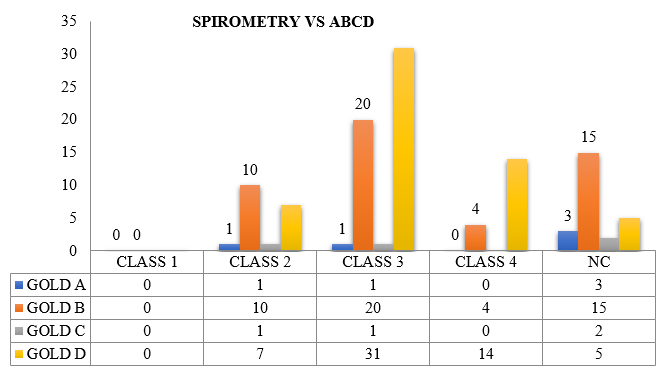
Spirometry vs ABCDgold
| SPIRO | Gold [ No of Persons] | |||
| A | B | C | D | |
| 1 | 0 | 0 | 0 | 0 |
| 2 | 1 | 10 | 1 | 7 |
| 3 | 1 | 20 | 1 | 31 |
| 4 | 0 | 4 | 0 | 14 |
| NC | 3 | 15 | 2 | 5 |
| P value | 0.014 | |||
| Chi square | 20.626 | |||
On comparing spirometric with ABCD grading maximum population corresponds to Class 3. The results are found to be statistically significant with p value of 0.014.
Discussion
The revised 2017 GOLD Guidelines emphasises that diagnosis of COPD by considering spirometric FEV1 predicted % grading and symptoms and exacerbations grading (ABCD) separately. The symptoms and exacerbation grading are considered to assess the severity of disease on patient’s quality of life.
However, in our study we considered ABCD grading for diagnosis of COPD in patients with symptoms suggestive of COPD-progressive dyspnoea, cough with expectoration, wheeze, childhood recurrent respiratory infections with associated exposure to noxious particles and/or gases. Following which patients were subjected to spirometry to confirm the diagnosis of COPD, the following results were observed.
Our study is to check the accuracy of ABCD grading in diagnosing COPD, thus can be helpful in diagnosing COPD in a resource limited setting, primary care centres where spirometry is not available.
In our study population about 50.4% were between the age group of 61-70 years followed by 22.6% were between the age group of 51-60years,10.4% in the age group of 41-50 years,11.3% were between the age group of 31-40years, 5.2% were between the age group of 21-30years with the mean age distribution of 56.59±12.5 years.
In our study population 90 were males and 25 were females, (i.e.) 78.3% were male and 21.7% were female.
COPD has traditionally been associated with older males (>50 years), recent evidence suggested that the disease is already present in 20–45 year old and that gender differences are becoming less pronounced. Likewise, in our study 16.5% of population belongs to the age group of 20-40 years. However, there is a significant difference in the male is to female ratio.
On assessing the educational status in our study population 47.8% had completed primary schooling, followed by 26.1% of illiteracy, 25.2% had completed under graduation and only 0.9% had completed post-graduation.
Socioeconomic status is also the risk factor for COPD. In our study population it was assessed using Modified Kuppusamy scale. Most of our study population belonged to lower middle class.
The results obtained were, 59.1% of our study population belonged to lower middle class, 26.1% belonged to upper middle class, 13.9% belonged to upper lower class and 0.9% belonged to lower class.
Smoking is the most common cause of COPD accounting for 85% (50% smokers develop COPD), the rest 15% is considered non-smoking COPD. In non-smoking COPD 30-50% accounts for biomass fuel exposure. Tuberculosis increases the risk by 2-6 folds even with adequate treatment. 14 In our study on taking individual risk factor into consideration 66.1% of population were smokers and the rest 33.9% were non - smokers, 40% gave history of treatment for tuberculosis in the past and rest 60% had no history of tuberculosis in the past, 23.5% were exposed to biomass fuel gas and 20% had history of passive smoking. This clearly says that smoking being the most important cause for COPD followed by the other causes-which is on the rise.
On evaluating the co morbidities, 67.8 % of population had Diabetes Milletus, 50.4% of population had Systemic hypertension, 16.5 % of population had Coronary artery disease and only 1.7% of population had Thyroid disorder.
Patients symptoms and risk factors suggesting COPD are diagnosed and classified according to ABCD grading.
mMRC scoring was done and individuals were categorised into two groups.
mMRC score ≤1 who will fall under Group A and C, which was about 24.3%
mMRC score ≥2 who will fall under Group Band D, which was about 75.7%
The mean mMRC score with standard deviation was found to be 1.97±0.674.
CAT scoring was done, and individuals were categorised into two groups.
CAT score <10 was found to be 7.8%, who will fall under Group A and C.
CAT score ≥10 was found to be 92.2%, who will fall under Group B and D.
The mean CAT score with standard deviation was found to be 14.80±4.117.
On comparing, CAT score resulted in about 16.5% increase in Group B and D population than mMRC score.
Number of exacerbations in the previous year
Most of our study population about 40.1% had one exacerbation in the previous year. Followed by 25.2% had two exacerbation and 13.9% had three exacerbations.19.1% of population had no exacerbation in the previous year.
On classifying patients based on ABCD tool-predominant of our study population belonged to Group B and D. The results obtained were 4.3% in Group A, 42.6% in Group B, 3.5% in Group C and 49.6% in Group D.
When these patients were subjected to spirometry majority of them had severe disease as per GOLD guidelines of spirometry. The results obtained were 46.1% of population in grade 3, followed by 16.5% in grade 2 and 15.7% in grade 4. We also inferred that 21.1% of population were not found to have COPD (i.e., they either had FEV1/FVC more than 0.7 or showing significant post bronchodilator reversibility and both of these in few individuals).
On comparing the CAT score with the spirometric grading: the study population was categorised as less symptomatic (CAT score <10) and more symptomatic (CAT score ≥10) and were compared to spirometric grades. Most of our study population in more symptomatic group had moderate (44.3%) and severe (15.6%) obstruction as per spirometry grading. In less symptomatic group 1.73% population belonged to moderate and severe grades each. The rest 21% were in the not conclusive group. The results were found to be statistically significant with p value of 0.045.Ghobadi, Hassan et al. studied the relationship of CAT scoring with spirometric airflow limitation grading. They compared mean CAT score (four groups) with mean FEV1 of spirometric grade and was found to have significant p value. 15 Similar statistical significance on comparing CAT score and FEV1 spirometric grade were seen in our study.
On comparing mMRC score with spirometric grading, we inferred that patient with severe disease as per spirometric grading had poor exercise tolerance (i.e., higher grades of mMRC). The results obtained were 40% had severe obstruction, 14% had very severe and 10.4% had moderate obstruction in more symptomatic group. In less symptomatic group (mMRC≤1) 6% of population had moderate and severe obstruction each, 0.8% had very severe obstruction. The results were found to be statistically significant with p value of 0.00. Dhanalakshmi 16 D et al. studied the relationship between mMRC grading and Forced Expiratory Volume in first second (FEV1) in COPD patients. The results were mMRC dyspnoea grade was inversely correlated strongly with post- bronchodilator % FEV1 (p value <0.001) than pre-bronchodilator % FEV1. This statistical significance was also found in our study.
On comparing the ABCD grading with the airflow limitation by FEV1 in spirometry, most of our study population belonged to Group B and D as per ABCD grading and most of them had severe airway obstruction as per spirometry grading.
The results obtained were GOLD Group A had 5 patients (4.3%) of which spirometry grade 2 and 3 had one each and the rest 3 patients were not found to have COPD.
Group B had 49 patients (42.6%) of which 10 patients corresponds to grade 2, 20 patients belong to grade 3, 4 patients in grade 4 and 15 were found to be not conclusive of COPD.
Group C had only 4 patients (3.5%) of which spirometry grade 2 and 3 found to have one each and 2 patients were found to be not conclusive.
Group D had 57 patients (49.6%) of which 7 patients were in spirometric grade 2,31 patients in grade 3, 14 patients in grade 4 and the rest 5 patients were in not conclusive group.
Graciane L Moreira 17 et al., which compared GOLD B-C-D groups with GOLD II-III-IV grades and the results showed 68% of study population belonged to Group D in ABCD groups and in Spirometry grades 51% of population belonged to severe airway obstruction grade. Similar results were found in our study. But they also analysed the functional status of the patients using Six minutes walk test, which was not considered in our study.
Conclusion
The utility of 2017 GOLD consensus in diagnosing COPD in the Indian scenario was studied. 79% of the study population diagnosed to have COPD by ABCD grading were confirmed by spirometry. CAT and mMRC test correlates with the spirometric FEV1 predicted percentage. The ABCD tool of GOLD consensus will be helpful in diagnosing COPD in a resource limited setting, primary care centres were spirometry is not available.

